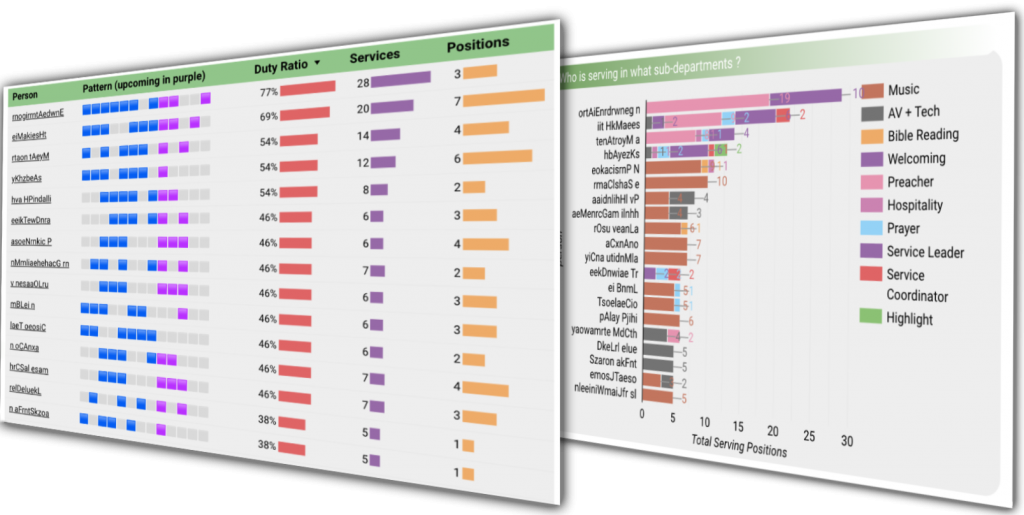
Ever wondered who the 20% doing 80% of the work is? Are you spread thin? What departments need more resourcing? Answer these questions and more with this powerful new add-on.
See who you could support and encourage to serve in a growing healthy church.
Note that this analysis is more powerful than the Toolkit’s “volunteer” metrics which simply looks at which members are volunteers (as marked by “is a volunteer” checkbox).
This add-on will help you see what people are being asked to do across your services. There are two pages:
- Activity: look primarily at required service resourcing as well as the most loaded volunteers and what their doing
- Load: look primarily at individual loading (sparklines) in both past and future rostering, as well as department requirements.
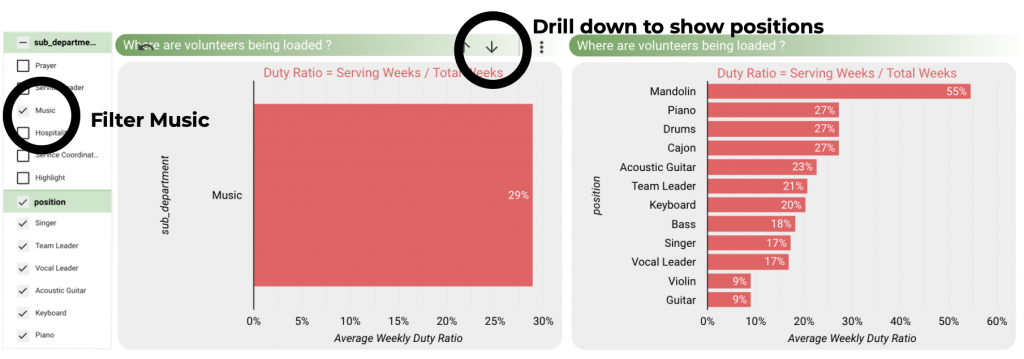
In both pages you can powerfully filter by congregation and position / department. You can also “drill down” by using the down arrow in particular graphs to expose sub-departments. In the example below, a filter is applied for all musicians at the sub_department level. Then, hovering over many of the graphs will reveal a drill down button (↓). Clicking this opens all positions within the music sub department.

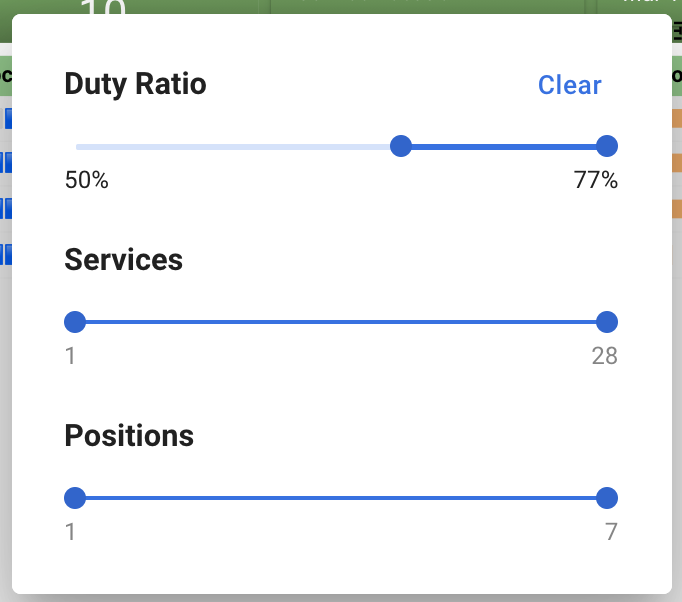
You can also use the “Metric Slider” in the top right of the people sparkline list to filter people of interest. In the example below, all people on more than 50% of services:

Let us know how you’re using this and if you’ve got any suggestions for improvement.
Note, that serving analysis in this add-on differs to the volunteer analysis in the toolkit. In the toolkit people are simply reported as having the volunteer checkbox ticked. In the add-on the actual rostered volunteers are analysed.
