
This add-on looks at a large service attendance data set and requires a different data set to most other dashboards.
If this is your first time setting up the dashboard jump down to the setup instructions here.
Use this add-on to answer questions like:
- How does your attendance compare with pre-covid ?
- Are more people attending and with what regularity since before ?
- How might your ministry need to adapt to what you’re seeing ?
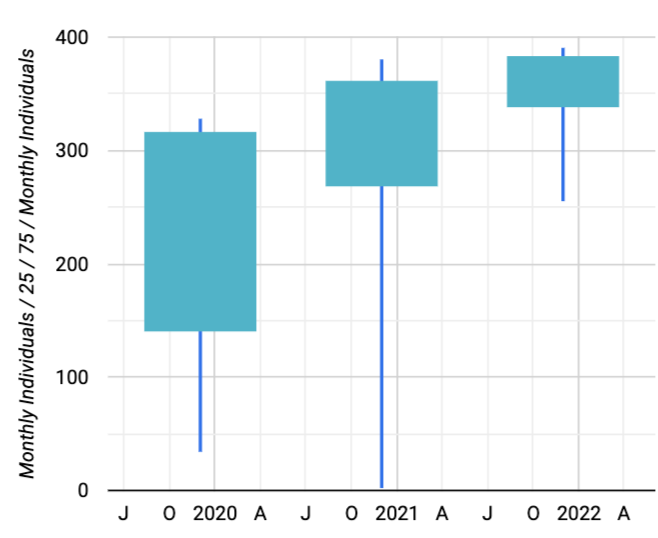
Raw Data (Long Range Attendance)
These simple graphs will show you the raw attendance data over time.

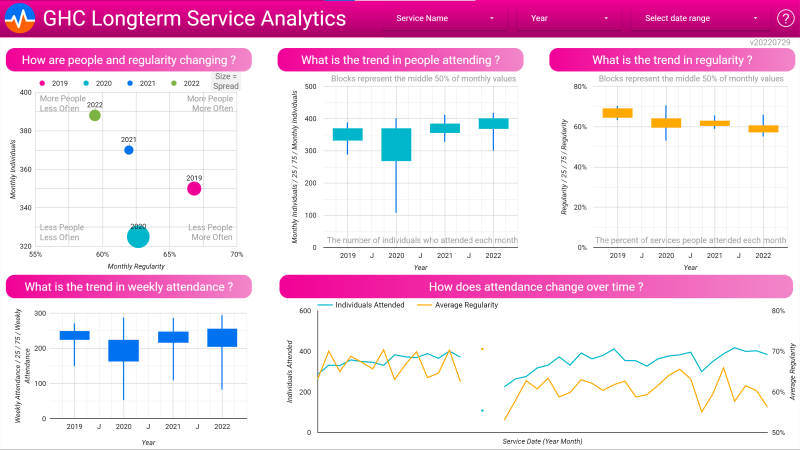
Statistics
Use this page to get analytic insight into the service attendance patterns of your church.
Setup
Step 1 of 5: Create Shared Report
In Elvanto create a shared report
- New Comprehensive report called Report of Longterm Service Individual Attendance
- Add a Built-in Service Individual Attendance Item
Those settings are:
- Custom Date Range – start with 1/1/2019 to 31/12/2025 (this can be increased to see longer range metrics, or decreased if it maxes out Elvanto or Google Data Studio)
- Frequency Each Service
- Attendance: Only people who did attend
- Filter services by locations (only select those that matter)
- Hide Times Attended
- Show individual service grid (Elvanto changed the formatting of their reports. Without this checked GHC will not be able to read the report)
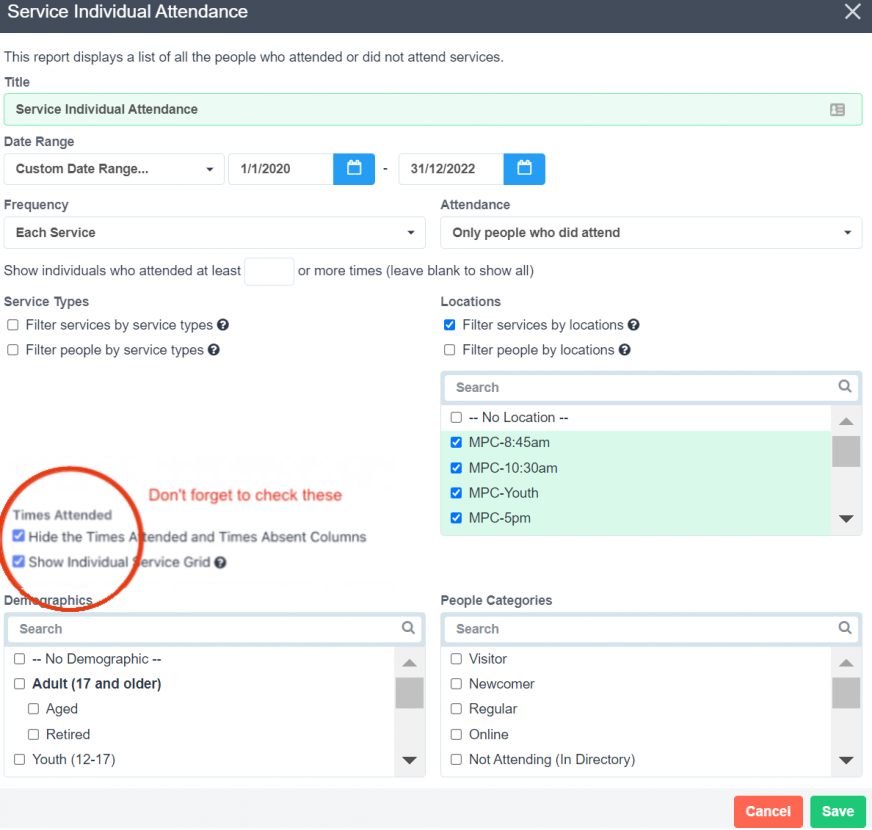
- Save and Generate Report
- Elvanto might fail to produce the report if there’s too much data over too long a time period. If this happens, simply add add multiple report items in the comprehensive report that breaks the time period into time segments (for example 3 report items each spanning 2 previous years for a total of 6 years of analysis)
- When report succeeds, click Share and set to Anyone with the link and copy the link
Step 2 of 5: Create Group to Feed Data into GHC
- Create a group named “Report of Longterm Service Individual Attendance”
- Paste the report URL into the group Address field
Step 3 of 5: Open template dashboard
Now open this GDS report. It will only show demo data.
Step 4 of 5: Create copy and extract data
Make a copy. Ignore both unknown data sources and the errors that will appear in the copied dashboard. They will be resolved when you complete this step.
- Menu > Resource > Manage added data sources
- Edit Extract Data
- Save and Extract (don’t set a refresh time for now)
- Finished / Close
The data will be frozen at this point in time. You can always refresh the data by editing ‘manage added data sources’ and ‘edit connection’ to hit ‘Save and Extract’ again.
Step 5 of 5: Copy dashboard link into myGHC
Copy URL of your copied dashboard
- Set share permissions with those in your team as needed
Paste the link in the share link page by clicking the button below.