
[toolkit_setup]
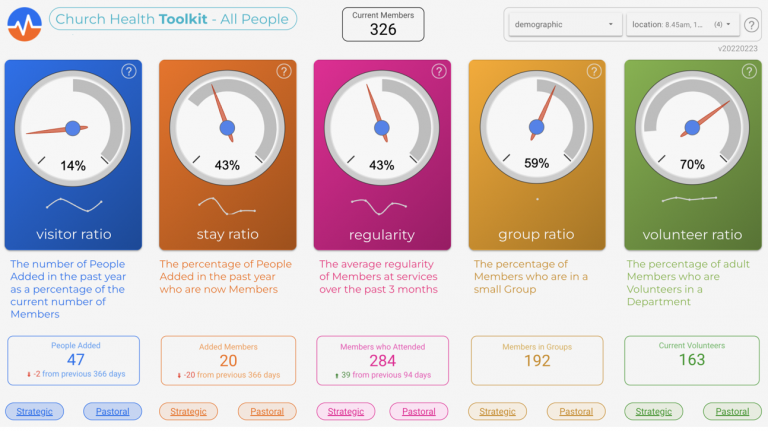
The Toolkit Platform focusses on 5 real time health metrics:
- Visitors
- Integration
- Service Attendance
- Groups (including attendance)
- Volunteering
The Toolkit is designed to help you explore rich data in your ChMS including attendance metrics in both services and groups.
The dashboards are broken into the 3 levels of health, strategic and pastoral.
Global Navigating and Filtering
You can navigate and filter across the whole Toolkit using these menu items:

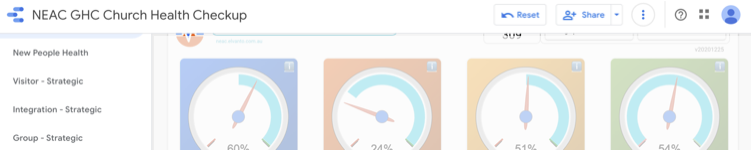
Health – all people
This is the main landing page in the toolkit and the beginning of your journey to focus on particular aspects of health and growth.
[table id=5 /]
Health – New People
This repeats the health dashboard but allows you to see the gauges for new people only. This is helpful to see how many are regular, starting to attend groups and serving.

Visitor Strategic
Use the visitor strategic dashboard to explore where and when new people came. Consider this your front door analysis.
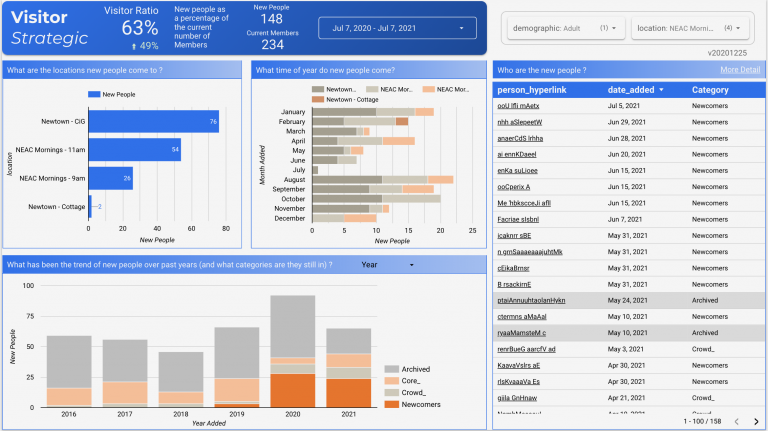
Questions you might want to ask to create a richer narrative:
- Why did these new people come? How many were unsolicited walk ins, how many came with friends?
- Why are some months / years better than others?
- What are the factors that make some locations/congregations more invitational/attractive?
Visitor Pastoral
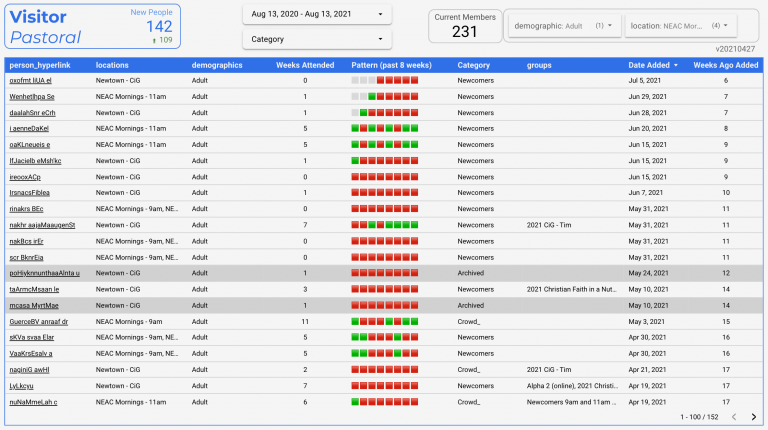
Table defaults to sorting by date added. Try also sorting by weeks attended to see in the sparklines how long ago people attended.
Integration Strategic
Use this page to examine the transition from newcomer to member.
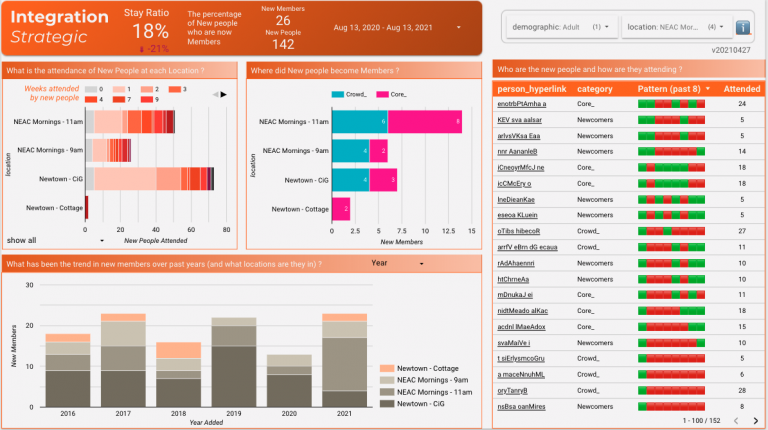
By comparing with the visitors page, use these questions you might want to ask to create a richer narrative:
- What has been effective to help people become members?
- Are there “blockages” at particular locations (high visitors, low membership)?
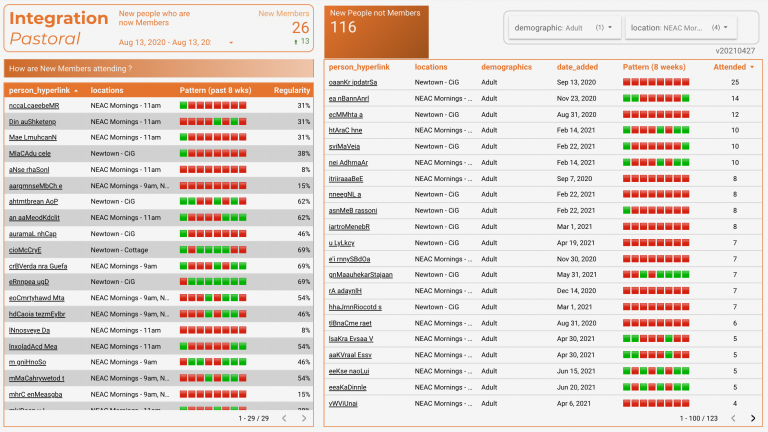
Pastoral actions – go to the pastoral dashboard to:
- How are new members tracking?
- Who should be encouraged to become a member?
- Who needs follow up?
Integration Pastoral
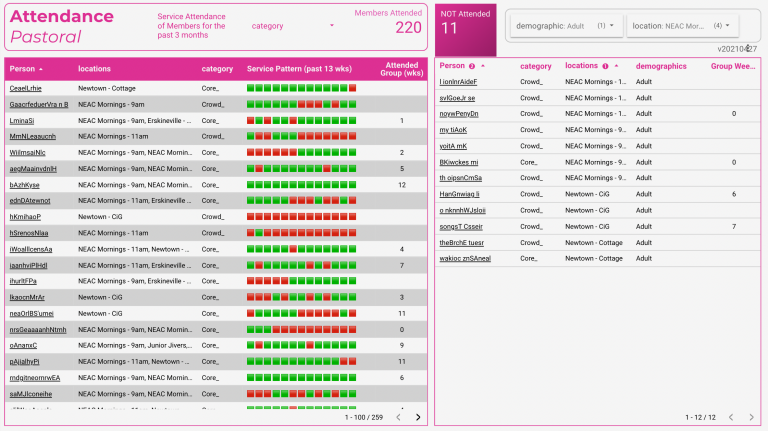
Attendance Strategic
Note that this dashboard shows member data only.
Further this page is based on where people attend. Not their location listed in their profile. For the same page based on person’s listed location refer to dashboard (Attendance Strat – Loc) at the bottom of the dashboard set.

Attendance Pastoral
Group Strategic
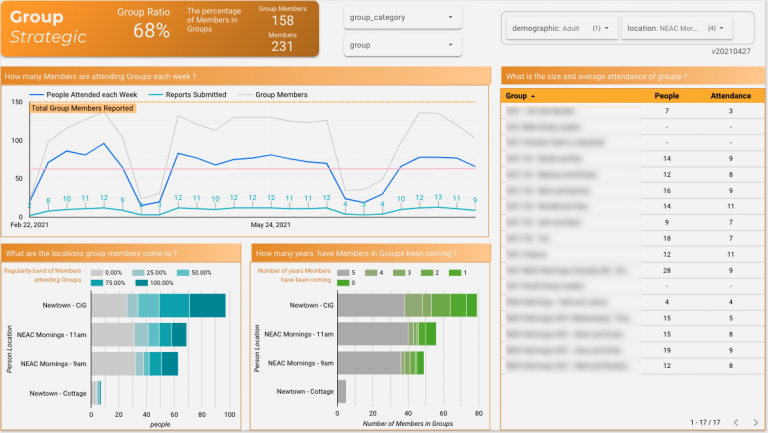
Meeting in smaller groups are critical to people’s discipleship. Use this page to explore the attendance and health of your small groups.
Questions you might want to ask to create a richer narrative:
- Which services have a healthy small group culture?
- Are groups being added to each year?
- Which small groups need to split (growth) or are poorly attended?
Group Pastoral

Volunteer Strategic
Use this page to explore how many people have marked as a volunteer in their profile. To consider actual serving loads and needs using the Serving Add-on.

Questions you might want to ask to create a richer narrative:
- How would you describe the culture of serving at each service?
Pastoral actions – go to the pastoral dashboard to:
- Are certain volunteers overloaded?
- Who might you consider asking to start serving?
Volunteer Pastoral

Data Quality
To get the most out of GHC tools (and your ChMS generally) it’s important to have complete and current data in key fields. The technical term for this is Data Quality which falls under the discipline of Data Integrity and Governance.
When new people are added to the ChMS their name and contact details are captured first. It’s often easy to leave it there and over time the job of catching up with other needed information can become overwhelming.
GHC tools rely heavily on 3 key fields being complete and current in People profiles :
- People Category – to distinguish a person’s “connected-ness” to your church (from Visitor/Newcomer/Crowd to Committed/Regular/Member to Core/Leader).
- Location – to distinguish the Congregation(s) that a person participates in
- Demographic – to distinguish the age band that a person is in
These fields allow the GHC tools to provide better analytics and insights through filtering.
The Location and Demographics fields should be completed in all People profiles, or at least for those of Members. It is also helpful to keep People Category settings current, in particular updating Newcomers who progress to Members.
Incomplete and out-of-date data can be identified through customised reporting in your ChMS. Details on this are provided below.
To provide an overview of your current status and help you plan the task of improving your Data Quality, a specific page has been included in the GHC Toolkit (under the Extras page group).
- Summary Ratios provide a quick measure of the state of your data. Values below 50% for Quality Ratio or 70% for Member Ratio may impact the analytics that GHC tools provide).
- Bar charts help you identify which areas need most attention (by Category, Group or Department). Clicking on a chart bar will filter the lists of people.
- Lists show which specific people have incomplete data. Clicking their name will take you to their profile in your ChMS and allow you to update it.
It is common to initially need to update many People which can be time-consuming to do individually. The following Advanced Searches will provide a list of people who can be updated in bulk using Mass Manage.

