
[dashboard_link ‘CHECKUP’ ]
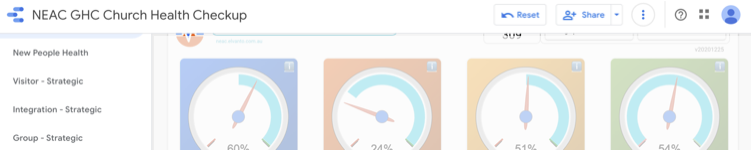
The Checkup Platform focusses on 4 real time health metrics:
- Visitors
- Integration
- Groups
- Volunteering
The Checkup is designed to help you explore real time metrics. The dashboards are broken into the 3 levels of health, strategic and pastoral.
Global Navigating and Filtering
You can navigate and filter across the whole Toolkit using these menu items:

Health – all people
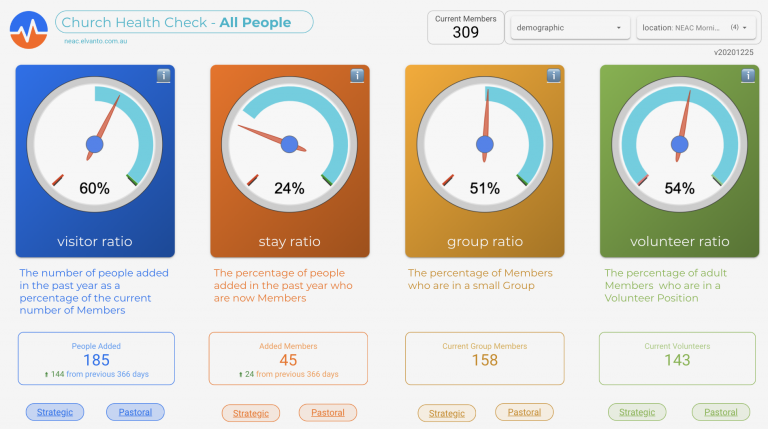
Visitors
Visitor Ratio (%) is the number of people added over the past year as a percentage of the current number of regular attenders (Members).
People Added is the raw number of people added over the past year. The comparison figure shows the change from the previous year.
Interpretation
- 100% = you had as many visitors over the past year as you have members (every member brought a visitor)
- 50% = your church is active in inviting people
- 20-50% = you have some active inviters (or your church is simply attracting some people)
- <20% low visitor activity
Questions
- Strategic: Which congregations are seeing the most visitors and at what points of the year do they typically come? Why is that?
- Pastoral: Who do you need to follow up?
Stay (integration)
Percentages
- 100% = every visitor became a member (people category marked with “_” suffix)
- 50% = your church integrated half of the visitors into your church
Questions
- Strategic: Which congregations are seeing the most visitors become members. Is there a difference between congregations visitors numbers and integration numbers. If so why?
- Pastoral: Who is in the visitor pipeline but not yet become a member?
Group
Percentages
- 100% = every member is in a group
- 50% = half of your members are in a small group
Questions
- Strategic: How active are small groups? Are small groups incorporating new people?
- Pastoral: Which leaders and members need particular support?
Volunteer
Percentages
- 100% = every member is available to serve (in a rostered department)
- 50% = half of your church is listed to serve
Questions
- Strategic: How active are each congregation? How long is it taking to activate members to serve?
- Pastoral: Who could serve? Who is overloaded?
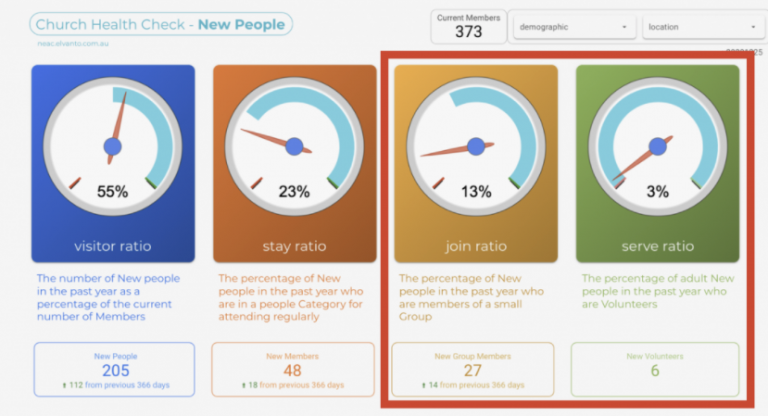
Health – New People
This repeats the health dashboard but allows you to see the gauges for new people only. This is helpful to see how many are regular, starting to attend groups and serving.
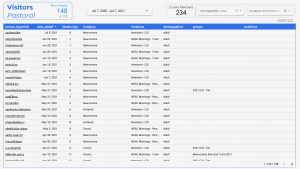
Visitor Strategic
Use the visitor strategic dashboard to explore where and when new people came. Consider this your front door analysis.
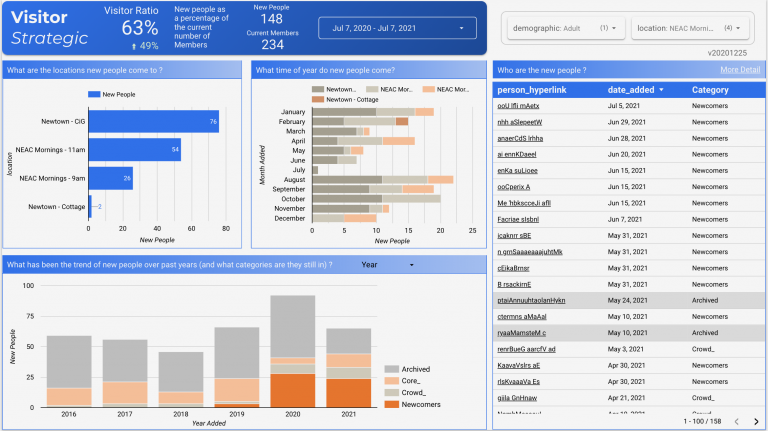
Questions you might want to ask to create a richer narrative:
- Why did these new people come? How many were unsolicited walk ins, how many came with friends?
- Why are some months / years better than others?
- What are the factors that make some locations/congregations more invitational/attractive?
Integration Strategic
Use this page to examine the transition from newcomer to member.
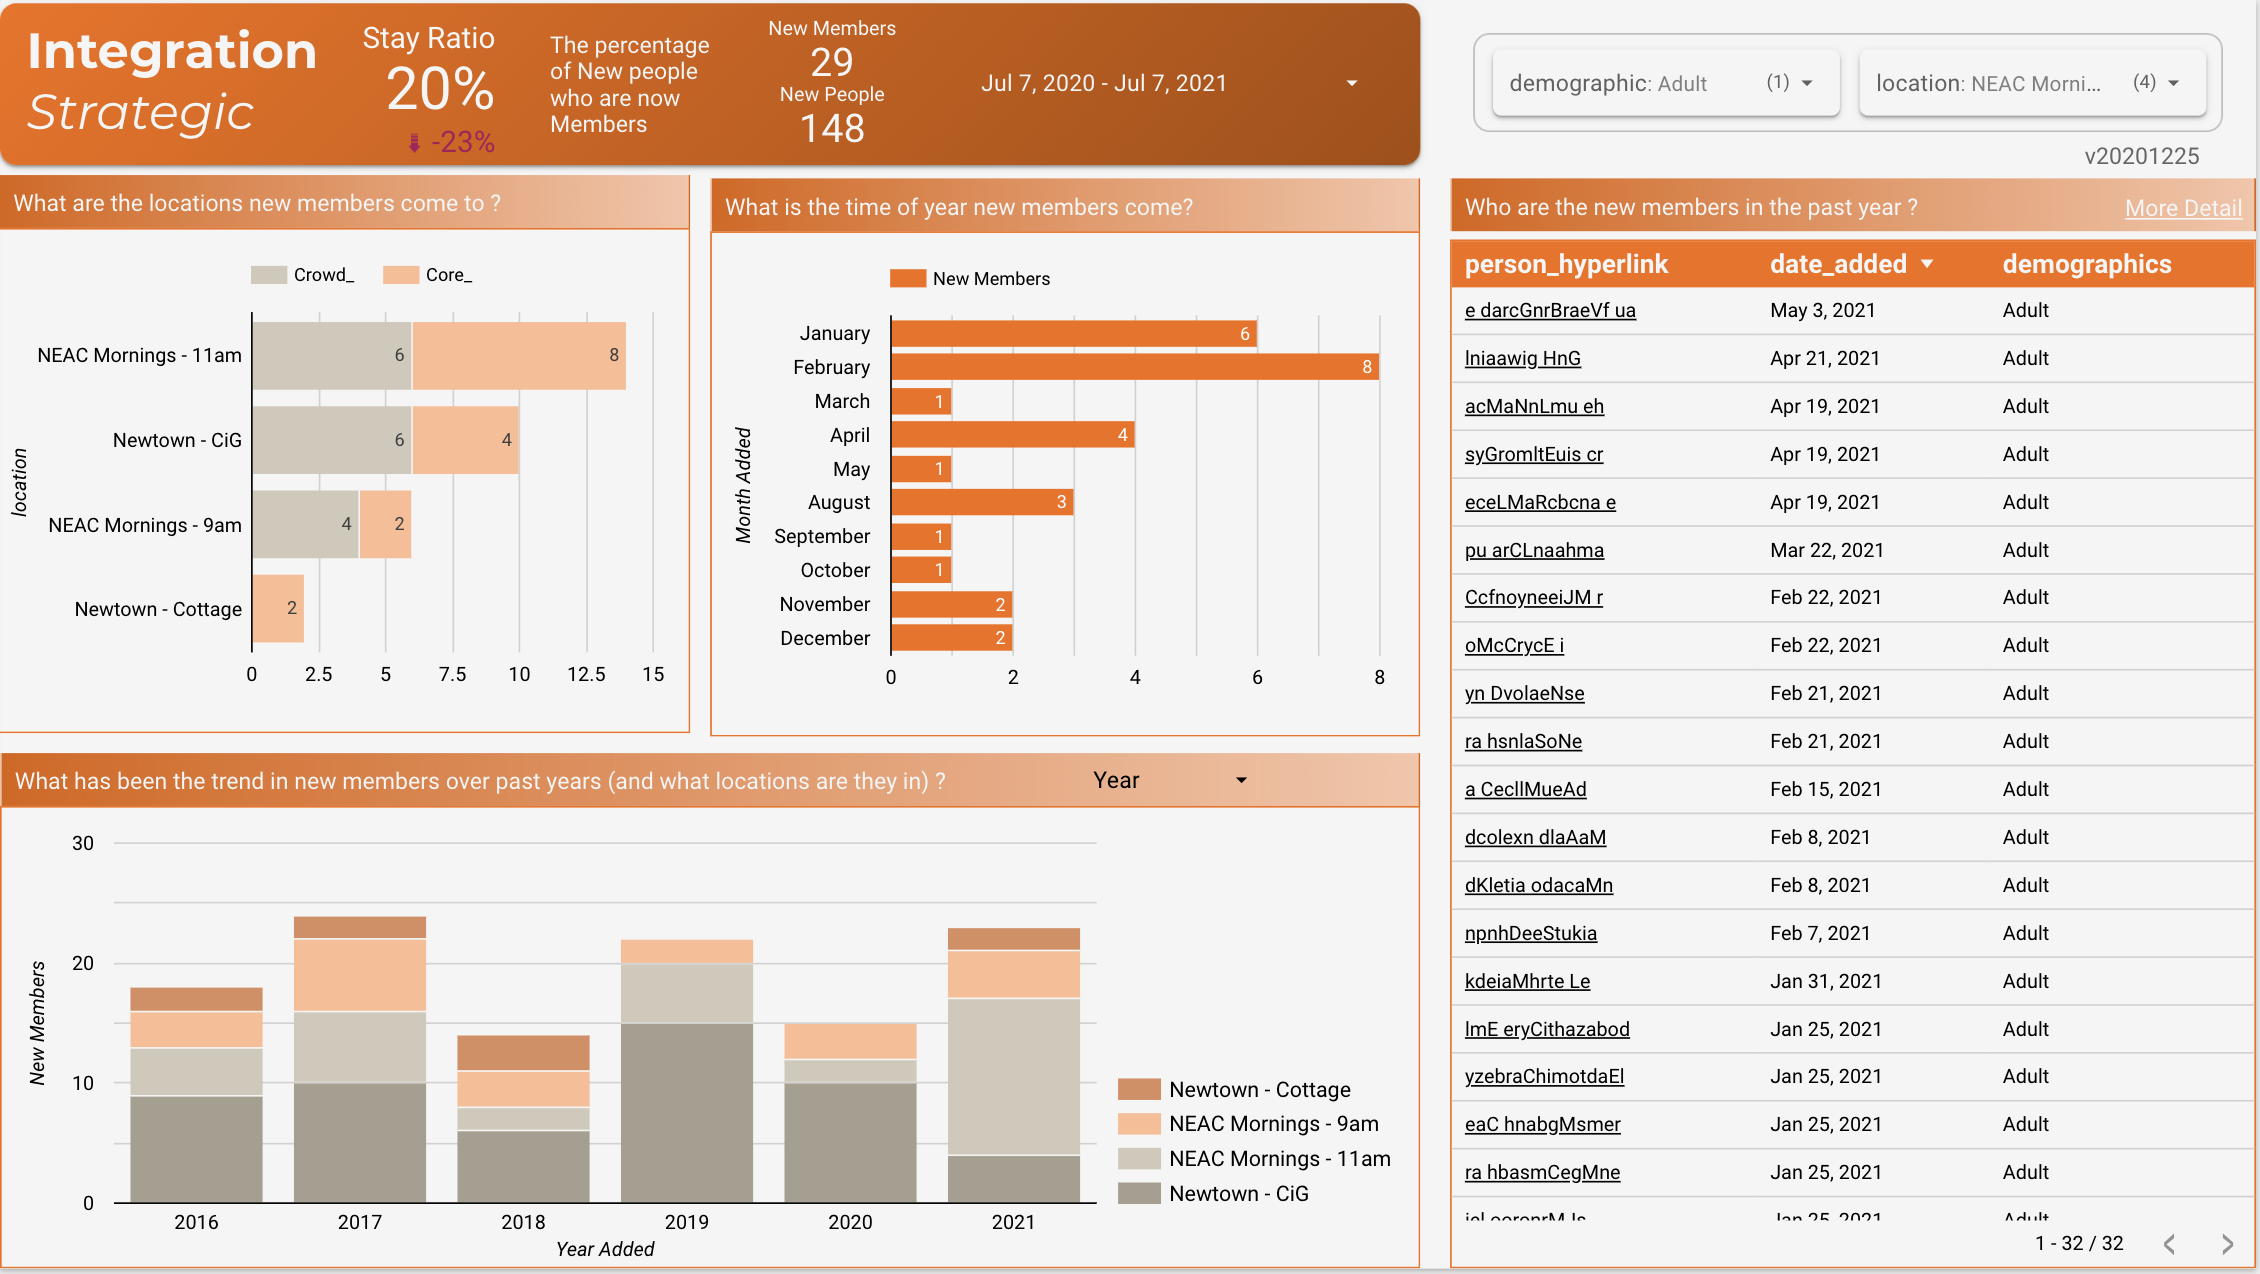
By comparing with the visitors page, use these questions you might want to ask to create a richer narrative:
- What has been effective to help people become members?
- Are there “blockages” at particular locations (high visitors, low membership)?
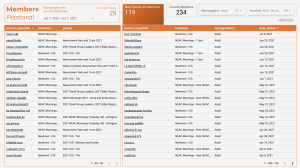
Pastoral actions – go to the pastoral dashboard to:
- How are new members tracking?
- Who should be encouraged to become a member?
- Who needs follow up?
Group Strategic
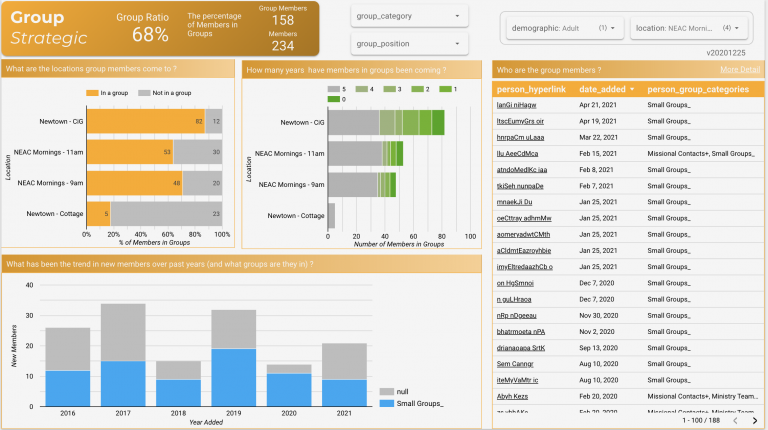
Meeting in smaller groups are critical to people’s discipleship. Use this page to explore the attendance and health of your small groups.
Questions you might want to ask to create a richer narrative:
- Which services have a healthy small group culture?
- Are groups being added to each year?
- Which small groups need to split (growth) or are poorly attended?
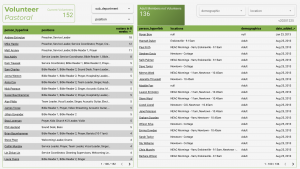
Volunteer Strategic
Use this page to explore how many people have signed up to serve. To consider active serving using the Serving Add-on.
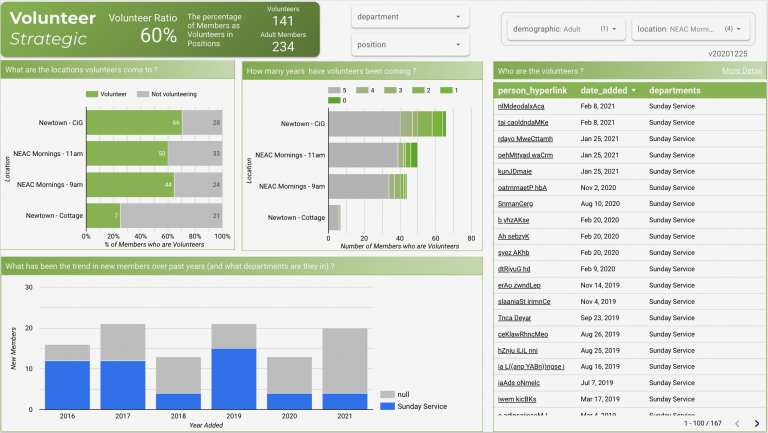
Questions you might want to ask to create a richer narrative:
- How would you describe the culture of serving at each service?
Pastoral actions – go to the pastoral dashboard to:
- Are certain volunteers overloaded?
- Who might you consider asking to start serving?
Pastoral Dashboards
Having discerned areas of focus and lead actions to pursue, use the pastoral dashboards to prioritise regular ministry.

Change log
| Date | Version | Release Notes |
|---|---|---|
| 02/07/2021 | v20210702 | First Release Create copy |